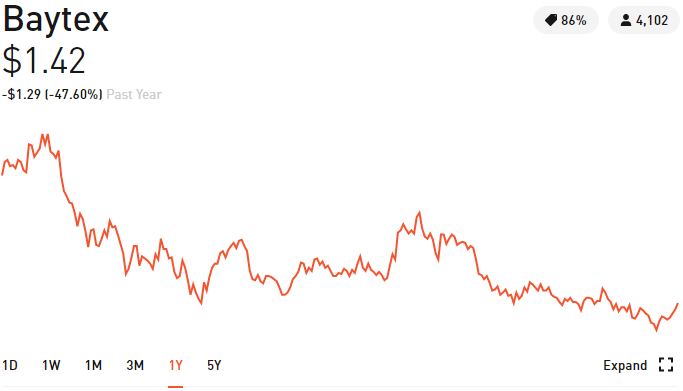
It finally happened. After two long months Baytex Energy finally stretched back up to my break even point around $1.44 per share. And thus, I sold!
Unfortunately for me, I fell slightly short of breaking even due to Robinhood’s revenue generating method of routing trades to behind-the-scenes parties instead of posting them on the public exchange. According to Robinhood’s SEC filing, they use Citadel Securities, Two Sigma, Wolverine, and Virtu to perform this work, and Robinhood makes over 40% of their revenue using this approach.
When I saw BTE hit $1.44 this morning, I placed a limit order to sell. Though the volume continued to increase and price hovered between $1.43 and $1.45, my sell order never filled. I canceled the order and resubmitted a sell order at $1.43. Again, it would not fill. Out of fear of missing my opportunity to get out around $1.44, I decided to submit a pair of market orders for 100 shares each and just see what I could get. Those orders filled for $1.41 and $1.42.
Quite frankly, I should never have bought these shares. I ran across the company when doing some research on Robinhood back in early July. I had a theory that I wanted to test after seeing a number of stocks hit some fairly sizable returns after first showing up on the “New to Robinhood” filter.
Baytex had been on a significant downward trend since dropping from its heights trading around $60 in 2011. In 2016, it dropped below $2 per share and has bounced between $1 and $5 ever since.
I had seen a few low-cost stocks hit fairly quick upswings between 5 and 10% after first appearing on the “new” filter, so when I saw Baytex Engery appear after their steady decline I thought, “this could be my chance!”
I bought in at $1.44 per share for 200 shares on July 10th. Only July 30th, it had run up $1.56 (a gain of 8%) before quickly dropping back below my break even point over the following days. I kicked myself for being greedy and missing my target, so I held on to the shares hoping they would bounce again and give me an opportunity to sell.
Ultimately, I knew nothing about the company, its leadership, and next to nothing about the industry in which they operate. It was a stupid buy, and I’m glad I was able to get out right around where I bought in.
YETI Holdings, Inc. (YETI): 10 shares @ $28.89 (-4.81%)
Baytex Energy Corporation (BTE): SOLD, net loss of $5.
Microsoft Corp. (MSFT): 1 share @ $137.52 (-1.14%)
Overall, my account value is now at $1,849, sitting on $333 in cash. Most of the market appeared fairly flat today. SPY finished up 0.05%. Yeti had a rough day today down almost 5%.
But holy cow, Tailored Brands (TLRD) had a monster day finishing up over 12%! This past month they are up almost 25%. Their earning is coming up later this week (after hours on Wednesday, 9/11). So we’ll see where they go from here.
Finishing the day up just shy of $70 (3.81%), my new account balance heading into this weekend is $1877. Almost back to where we ended our first day of this journey, which was $1878. We’re on a roll!
YETI Holdings, Inc. (YETI): 10 shares @ $30.35 (3.83%)
Baytex Energy Corporation (BTE): 200 shares @ $1.36 (3.03%)
Microsoft Corp. (MSFT): 1 share @ $139.10 (-0.68%)
For the week, CGC was the big winner up 17%. YETI gained 7%, BTE gained 6%, and MSFT gained just 1%. And my overall account is up 13% for the week.
I touched on this yesterday, but man, that was a HUGE bounce off the bottom for Canopy. Canopy Growth Corp hit its 52-week low (intra-day) on Wednesday, August 28, 2019, when it dropped to $22.76. Today, CGC hit $28.15, an increase of almost 24% in just over a week.
The two stock’s I’ve been keeping an eye on based on Michael Burry’s recommendation, Sportman’s Warehouse and Tailored Brands, also had huge days today. SPWH was up just shy of 7.5% mid-day before settling back down and finishing the day up 4.5%. TLRD peaked at an almost 10% gain before 9am PDT before also settling at the end of the day up just over 4.5%.
I’m still excited to pursue the OptionAlpha trading strategies. I have been chipping away at the Intermediate course and am still enjoying learning. Definitely loving the growth over this past week in my current positions that will hopefully stay on track and allow me begin OptionAlpha with a starting position of at least $2,000.
YETI Holdings, Inc. (YETI): 10 shares @ $29.23 (1.42%)
Baytex Energy Corporation (BTE): 200 shares @ $1.32 (3.13%)
Microsoft Corp. (MSFT): 1 share @ $140.05 (1.76%)
Canopy was obviously the big winner today. Almost 7.5% gain. That was a huge swing. I expect it may shed a bit of those gains tomorrow but we’ll see. I might have missed out on the opportunity to hit the exact bottom late last week. But it is certainly nice to see the hole that was dug in that position to start to fill back in a little bit (still down about $436 in total).
I’ve just about broken back even in YETI (down about $10) and BTE (down $24). Microsoft is up a few dollars (about $4) from where I originally purchased it, but is also nearing its all time high of $141.68. Watching the technicals, it might be nearing some resistance so I could see selling that one share off and combining those funds with my next $100 deposit to open up some new positions.
I’m still watching Sportman’s Warehouse and Tailored Brands for an inciting opportunity to buy in. Just keeping my patience!
Pre-market saw a big selloff and my account value dropped about 1.7% (or around $30) before the markets even opened. There was a late rally and in the last 2 and 1/2 hours of market open I swung up to a gain of just over 2%.
Ultimately, my account value ended the day at $1,697 (up just shy of 2%).
YETI Holdings, Inc. (YETI): 10 shares @ $26.62 (-5.77%)
Baytex Energy Corporation (BTE): 200 shares @ $1.26 (-1.56%)
Microsoft Corp. (MSFT): 1 share @ $136.04 (-1.32%)
My positions in YETI and CGC duked it out today. I made just over $43 with Canopy’s move, but YETI tanking nearly 6% cost me $15.50.
I’m still down about $500 total in my Canopy shares. Ouch! That’s still painful to see. I have yet to decide if its something I’m willing to put all my eggs into.
Checking into a few fundamentals, all four companies appear to be still in the buy or hold zones. So I’m not chomping at the bit to sell out unless something suddenly has a big move.
Microsoft is probably the one I’m most willing to sell at the moment. I think they are doing fantastic on just about all fronts (moving everyone to a subscription model for Office and Windows, and continually deploying best of breed solutions in Azure).
Their chart’s technicals are just kind of sitting at the middle of the road between buy and sell at the moment. So I think I could always sell that single share off and wait for a more opportune time to buy in.
I also checked in on Tailored Brands (TLRD) and Sportsman’s Warehouse (SPWH) from Michael Burry’s comments the other day on the bubble he’s seeing in passive index funds (and the underlying stocks) and opportunities for small cap winners. Both of these companies have mixed technicals and are still not quite in the buy range for me. TLRD had a big jump up almost 6% shortly after market open this morning before ending the day down about 1.5%.
In honor of Labor Day, I spent a few hours this weekend reading up on strategies for estimating all things retirement.
With the increasing popularity of the FIRE movement (Financial Independence, Retire Early), there is a ton of information out there for how you can calculate how much money you’ll need in order to retire (based on how much you are spending today), and calculating how many years you have until you can retire (based on how much you are spending versus how much you are saving).
It was an interesting exercise to mull over our family’s numbers and start thinking about what financial independence looks like to me and my family. I don’t consider myself a die hard FIRE evangelist, but I am hoping and planning on retiring sometime before I reach my mid-60s and qualify for social security (if that is still around by the time I’m eligible).
So, how do you calculate all this stuff?
The 4% Rule
The 4% rule was originally introduced by MIT graduate and financial planner William Bengen in 1994. Then again in 1998, a group of professors performed a similar analysis and confirmed the 4% rule in the Trinity study.
Essentially, both groups were trying to determine how much retired individuals could “safely” withdraw from their retirement accounts without running out of money before they die (or approximately 30 years, if you’re comfortable pinning a date on something like that). What both groups determined is that a person has sufficient savings and are ready to retire if 3 to 4% of his or her assets are sufficient to cover a year’s worth of expenses.
How much will I spend in retirement?
This is a tough number to estimate. The most logical place to start is with how much you are spending today. So first, get a solid understanding of your budget and where are you sending each of your dollars each month/year.
Then, you have to make some guesses at how you plan to spend your time and money in retirement. Do you plan to by-in-large live the same lifestyle? Or maybe you need to increase the amount you are budgeting for travel if you intend to spend more time away from home.
And healthcare expenses are a huge guessing game. A USA Today article from earlier this year estimated that a 65 year old couple retiring in 2019 will spend approximately $285,000 in healthcare expenses out-of-pocket, beyond what is covered by Medicare.
Shockingly Simple Math Behind Early Retirement
In 2012, a blogger known as Mr. Money Mustache wrote a fantastic article trying to demystify a few calculations that determine how far away you are from retirement. He boiled everything down to a single factor — your savings rate, as a percentage of your take home pay. Breaking things down a bit further, your savings rate can be calculated by two factors: (1) how much you take home each year, and (2) how much you can live on.
So based on the percentage of your take home pay you are saving each year, you can easily determine how much longer you will have to save before having enough money to retire. The chart breaks down like this:
Savings Rate (%)
Years Working Until Retiring
5
66
10
51
15
43
20
37
25
32
30
28
35
25
40
22
45
19
50
17
75
7
100
0
Now, this table makes a number of assumptions, but you’ll have to decide for yourself if you agree with these or not:
You’ll earn 5% annual return on your investment after inflation.
You’ll live off the 4% safe withdrawal rate after retirement (including lowering spending during times of recession).
You want your savings to last forever.
Mr. Money Mustache then published a subsequent article in 2015 regarding calculating your net worth. In the bottom third of this article, he further explains how to calculate what he calls your “take home pay.” This is different from your net income. You still subtract your income taxes from your gross income, but then you add back in your employer 401k match to get your total take home pay.
Then, to determine your savings rate, you total up your annual spending, and subtract that from your take home pay. Then, divide the result by your take home pay, and multiply by 100. This gives you your savings rate as a percentage.
Find your savings rate on the table above to determine your years of work remaining until retirement. Or, for a more graphical view of this, simply take a look at the calculator over on networthify.com.
What Does This Mean For Us?
In totaling up our current expenses and estimating our expenses in retirement, my wife and I have set ourselves the goal of building a retirement saving of $1,250,000. We believe this will allow us to live comfortably off the investment income extending the principal balance beyond our years.
So how old will we be when we retire? Well, this is bit tougher number to calculate. To determine our take home pay, spending rate, and savings rate, we had to do quite a bit of work with the numbers.
You see, our goal is also to have our house paid off by the time we retire. Definitely a lofty goal that is going to take good bit of patience and dedication. It will also depend on a ton of factors, like if we end up staying in our current home long term, if we’re able to be more aggressive in paying down the principal, etc. But, it is still our goal, and will have the effect of reducing our monthly spending in retirement rather significantly.
In addition, when living off of our investments in retirement, our income will be significantly lower than it is today. So, while our goal is to continue to be generous, we will likely be significantly reducing the amount we are tithing each month.
After all these calculations, as best we can tell we have approximately 18 more years of working until retirement, putting both my wife and I somewhere between 50 and 55 when we reach those golden years. Not too shabby! And, if we can increase our income or decrease our spending, we potentially could accelerate that timeline even more.
Now, life certainly has a whole lot of time out in front of us and any number of things can change these calculations drastically. God may have different plans for us and our number one priority is to faithfully follow whatever path He is laying out in front of us.
But, it was a fun exercise to learn and crunch through the numbers. And I hope/plan to revisit this every few years as a check in to see how we are progressing.
Feel free to comment below on your own journey, or poke holes in the theories or logic behind any of this. And finally, thanks for taking the time to hear our story!
I don’t remember where I saw it, but somewhere I saw a comment that heading into a three-day weekend is often a down day in the market. Apparently, that was a little bit prophetic for today.
YETI Holdings, Inc. (YETI): 10 shares @ $28.25 (-0.60%)
Baytex Energy Corporation (BTE): 200 shares @ $1.28 (-0.78%)
Microsoft Corp. (MSFT): 1 share @ $137.79 (-0.24%)
Heading into Labor Day Weekend, we’ve shed just over $25 and are sitting with a new account balance of $1667.
One other thing I’ve been reading a bit about lately is comments by Michael Burry regarding the bubble in passive investments. It is an interesting thought that because so many people are piling more and more money into low-fee investments from companies like Vanguard and Fidelity, a bubble could be forming (or have already formed) in those funds and in the underlying stocks.
According to Morningstar, in 11 of the past 12 years money has moved out of active investment funds and into passive funds. Burry is looking for small cap companies around the globe as opportunities that have been overlooked by the passive investment index funds, and highlighted recent investments in GameStop, Sportman’s Warehouse, and Tailored Brands.
I’ll have to do some digging into those stocks to see how they look. I’m not a huge GameStop fan (just of the stores themselves), so that one might be a pass right off the bat. But the others are intriguing.
Somewhat interesting after yesterday’s thoughts of wanting CGC to be low and my other stocks to be high before rotating between positions, that is exactly what has happened today.
YETI Holdings, Inc. (YETI): 10 shares @ $28.42 (4.26%)
Baytex Energy Corporation (BTE): 200 shares @ $1.29 (4.03%)
Microsoft Corp. (MSFT): 1 share @ $138.12 (1.89%)
Baytex Energy Corp. is now up over 10% over past two days. I’m still upside-down by about 10% in that one with an average cost of $1.44 per share.
Yeti Holdings, Inc. is up about 8% over the past two days. Similar story in that one in that I’m still upside-down by just over 7% with an average cost of $30.23.
And I’ve turned back positive in my one share of Microsoft, netting a whopping $1.72 (1.26%).
Canopy Growth had some pretty high volatility today, starting out the day up around 2% before swinging down to -0.30% before 10am EST, then swinging back up near 2% before dropping back down and hovering between 0 and -0.50% for the rest of the day.
All in all, not a bad day. Ended up with an account value of $1,695.
Still contemplating the “all in” move into CGC. I’m just not sure I’ve got the iron clad hands to hold that stock until it finds its bottom. Or the trust that with Constellation Brands and Mark Zekulin at the helm it can once again reach or exceed its peak around $50 per share.
YETI Holdings, Inc. (YETI): 10 shares @ $27.26 (3.49%)
Baytex Energy Corporation (BTE): 200 shares @ $1.24 (6.90%)
Microsoft Corp. (MSFT): 1 share @ $135.57 (-0.13%)
Continuing on with yesterday’s contemplation of selling everything else and doubling down on Canopy Growth Corp, one of the things I’ve come to recognize that is preventing me from doing this is that I’m really looking for two stocks each move in opposite directions at the same time to give me confidence in pulling the trigger.
For example, if CGC goes down, and YETI jumps up, then I’d love sell YETI and move that money into CGC. But, what’s ironic about that, is that if/when YETI has a day that it jumps up, I’m hesitant to sell it because I’m hopeful it will keep going up. This is where my lack of technical analysis is causing some paralysis.
So, it’s probably time to start figuring out what technical indicators I’m going to lean on to have confidence it is the right time to buy or sell.
It’s almost too painful to watch. I think it might be finally time to abandon this CGC top heavy ship. Down again today another 4%, around $70.
My account balance has tumbled down to $1,623. Now if I’m going to start my Option Alpha journey with a $2,000 splash, I’ll have to add in another $400 just to get started. So painful. I was just hoping to catch a bounce before selling.
YETI Holdings, Inc. (YETI): 10 shares @ $26.34 (2.17%)
Baytex Energy Corporation (BTE): 200 shares @ $1.16 (-4.92%)
Microsoft Corp. (MSFT): 1 share @ $135.75 (0.21%)
But, between family being in town and being out of commission with the sickness, I haven’t yet had a chance to start on the Intermediate Option Alpha course. So, even if I were to sell my current shares and move the money from Robinhood to TD Ameritrade, I am not yet confident in my ability to begin attempting the OptionAlpha strategies.
The other thoughts that keeps lingering in the back of my mind are…
What if Canopy is about to break out on another tear?
Could lightning strike a third time?
And if so, should I load up on shares at the current low price?
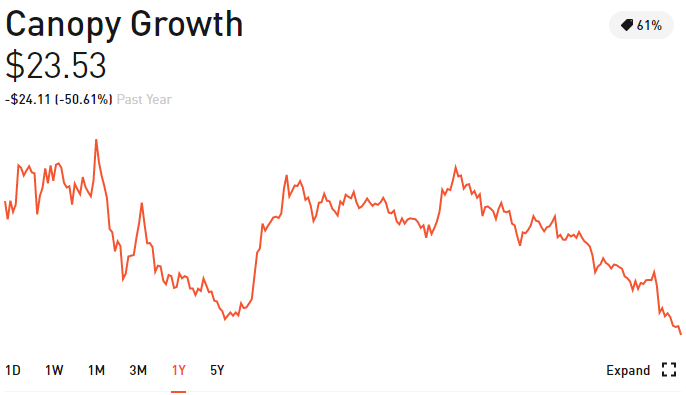
Take a look at these charts.
Canopy Growth Corp (1 Year)
Canopy Growth has been here twice before, in the low to mid $20s.
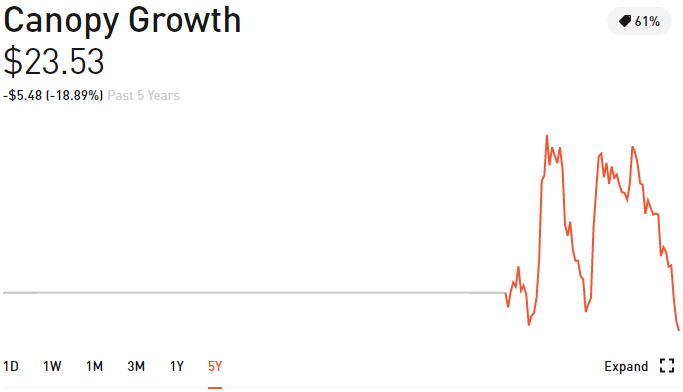
Canopy Growth Corp (All Time)
Shortly after being listed on the NYSE, CGC hit a low of $24.31 on July 30, 2018. This launched its tear over the next 39 days to a peak of $51.53. If you bought at the low and sold at the high, you could have netted a cool 111% gain in just over one month.
Fast forward to December 21, 2018, and CGC once again hits a low of $26.22. Over the next 42 days reaches a high of $48.88. Again, if you bought at the low, and sold near the peak, you could have netted another 86% gain.
My current average cost into CGC is $37.20. I could sell off YETI, MSFT, and BTE, and with adding a little bit of extra cash buy 30 shares of CGC for its current price of $23.53. My new average cost would be $31.34 per share.
Then, if CGC goes on another tear up to $50, I could sell all 70 shares for right around $3,500. I’m just not sure what trigger or event would cause lightning to strike for a third time. Of course, I’m not naive enough not to notice how simple such a statement is… “if the stock just doubles, then I’ll double my money!”
Didn’t sell any stocks. Didn’t buy any options. Just stood pat and waited to see what direction the market went (and more importantly to me, the direction the few stocks I own went).
I’m also finally starting to kick this bout with a cold, so that’s a relief.
Aside from a brief ray of sunshine in the pre-market hours (was up 2.7% for a gain of around $45), things prices mostly bounced sideways for me all day.
At the end of the day, my account balance is sitting at $1,694.